The employment number was stronger that the consensus was looking for, but it was not far enough from those expectations to have an impact on the markets. In fact, the yield on the 10yr note is slightly lower than it was at yesterday’s close, and the S&P futures are signaling a slight gain in the stock market today. In other words, these numbers don’t look like they’re going to be enough to create any kind of increase in volatility today….and therefore, a lot of investors are going to start their long weekend even sooner.
With this in mind, we’re going to keep this morning’s piece short and sweet. Tesla (TSLA) has not been in the headlines for months, but that is unlikely to last forever, so we thought we’d take a look at the chart on the stock. They reported their 2nd quarter deliveries this morning…and they came-in a bit lower than expectation. It was only a slight miss, so it does not look like it will be a catalyst for a breakout move in the stock in either direction.
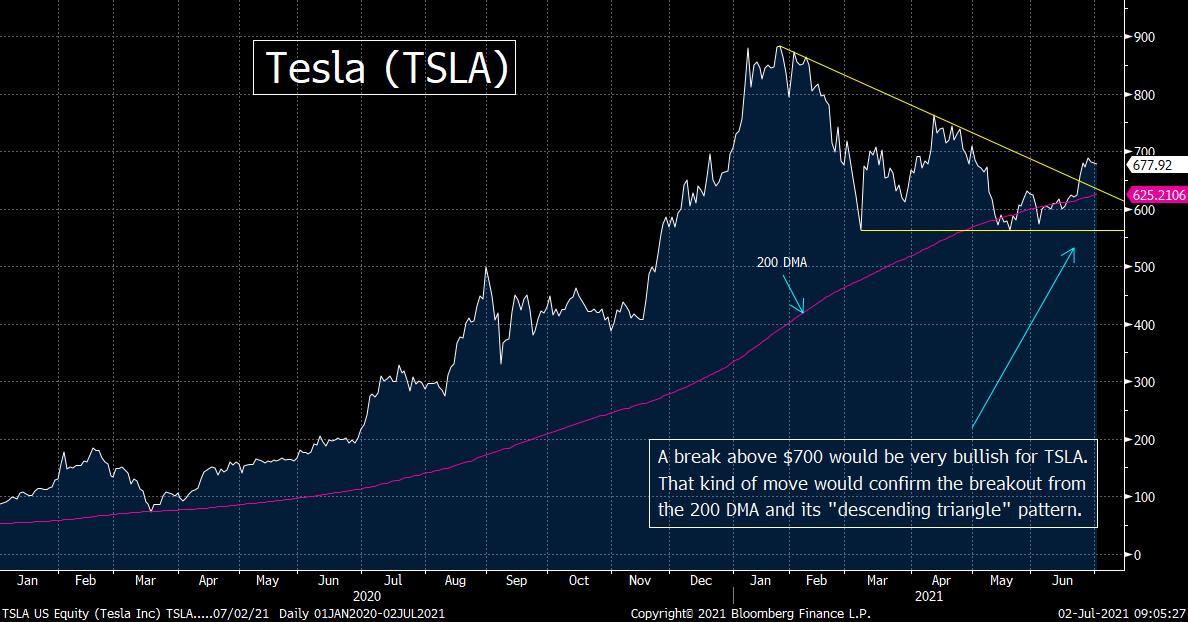
That said, the stock has recently set itself up for a breakout to the upside. No, it has not rallied quite enough yet for us to raise a big green flag on the stock, but the potential is there for an upside breakout if it can rally above the $700 level in any meaningful way.
To be more specific, a couple of weeks ago, TSLA was able to rally smartly. This helped the stock pull away from its 200 DMA. TSLA had been “riding” its 200 DMA for more than a month, so the fact that it was able to pull away from that moving average was a positive development. That jump also helped the stock break above the top line of a “descending triangle” pattern, so that was positive as well.
However, as good as this move was, it did not immediately lead to any renewed upside momentum. Instead, it has been bouncing around in a $30 range between $670 and $700 of the past week or so. In other words, even though TSLA has been able to break above two key technical levels, those “breaks” have not yet been meaningful enough to confirm the breakout (and to negate any chance that this move is merely a “head fake”)……Therefore, we’ll be watching the $700 level as we move further into the third quarter. Any meaningful break above that level should the kind of development that will give the stock a new material upside leg.
Of course, if it breaks below its recent $670-$700 range, it will be disappointing. However, we still have the 200 DMA as the more important support level. Thus, if it breaks below $670, it’s not going to raise a big red warning flag. Instead, we’d have to see it drop below its 200 DMA in a material way before we would raise a red warning flag on the stock. (The 200 DMA stands at $625 lately.)
One last note. TSLA is close to seeing its 50 DMA cross below its 200 DMA. HOWEVER, we have to remember that a REAL “death cross” involves the 50 DMA crossing below the 200 DMA when they are BOTH declining. Right now, the 200 DMA is still rising, so if they cross over the next week or two it will NOT be a true “death cross.”…….Don’t get us wrong, a declining 50 DMA crosses below a rising 200 DMA, it would still be somewhat negative…it just wouldn’t be as negative as some people might try to portray it.
Matthew J. Maley
Chief Market Strategist
Miller Tabak + Co., LLC
Founder, The Maley Report
TheMaleyReport.com
275 Grove St. Suite 2-400
Newton, MA 02466
617-663-5381
Although the information contained in this report (not including disclosures contained herein) has been obtained from sources we believe to be reliable, the accuracy and completeness of such information and the opinions expressed herein cannot be guaranteed. This report is for informational purposes only and under no circumstances is it to be construed as an offer to sell, or a solicitation to buy, any security. Any recommendation contained in this report may not be appropriate for all investors. Trading options is not suitable for all investors and may involve risk of loss. Additional information is available upon request or by contacting us at Miller Tabak + Co., LLC, 200 Park Ave. Suite 1700, New York, NY 10166.
Recent free content from Matt Maley
-
 THE WEEKLY TOP 10
— 10/23/22
-
 Morning Comment: Can the Treasury market actually give the stock market some relief soon?
— 10/21/22
-
 What Do 2022 and 1987 Have in Common?
— 10/19/22
-
 Morning Comment: Which is it? Is stimulus bullish or bearish for the stock market?
— 10/17/22
-
 Morning Comment: Peak Inflation is Becoming a Process Instead of a Turning Point
— 10/13/22
-
{[comment.author.username]} {[comment.author.username]} — Marketfy Staff — Maven — Member


