Modern times demand modern thinking in portfolio design. Learn more...
Happy Monday. To review, our plan is to begin each week with a review of the important indicator boards. The goal of this exercise is to keep readers "in tune" with the weight of the evidence in the market on an ongoing basis. So, without further ado, let's get to it.
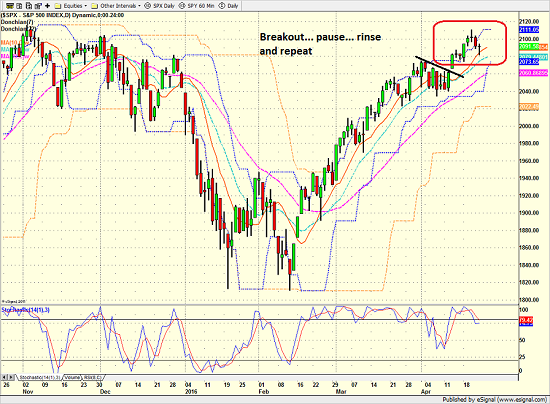
As always, we start with the price/trend of the market. From a shorter-term perspective, it appears that the S&P managed to break above 2075 on April 13 and has since held above this all important line in the sand. While we would expect to see a test of this area (which could include a dip back below 2060) the fact that the stocks did not immediately retrace the move is certainly a positive.
S&P 500 - Daily 
View Larger Image
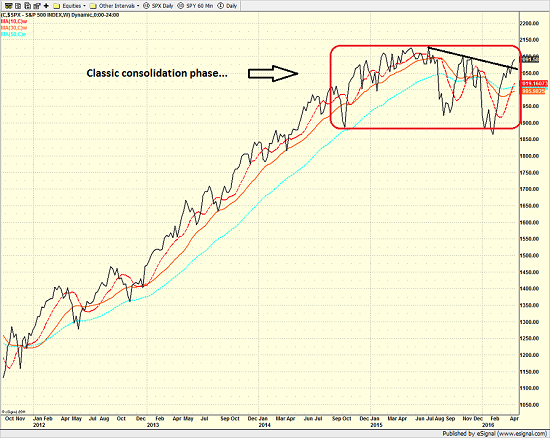
From a longer-term perspective (e.g. a weekly chart of the S&P 500), once again there really isn't anything new to report. As I have written recently, it looks to me like stocks remain in a sideways consolidation pattern. The thinking is the market continues to digest the big move higher that took place from 2012 through 2014. The good news is the textbooks tell us that stocks tend to exit a consolidation pattern heading in the direction they were going when the pattern began. Therefore, if we assume that stocks are entrenched in a secular bull market, we should expect to see a breakout to the upside - eventually.
S&P 500 - Weekly 
View Larger Image
The consolidation argument is even clearer when one looks at a monthly chart of the market.
While this sideways pattern isn't evident anywhere else on the monthly chart of the S&P over the past 20 years, I believe that the era of global ...


