

Support & Resistance 101: Apple Edition
Technical Analysis can get complicated at times. This really depends on the practitioner. Me, I like to keep things simple. When prices break a key level of support, that former support tends to be resistance on any rallies back to that level. The same thing on the flip side when former resistance turns into support on pull backs. Today I wanted to share a very clean example of this principle that we refer to as: Polarity.
If you’ve been following along, you know I was bullish Apple stock early in the year with an upside target just under $130. Since those upside objectives were achieved in late February, we said there has been no reason to be involved with this stock (at least from an intermediate-term perspective) until the sideways range since February resolved itself in one direction or another. We wanted to either buy the breakout above the lows 130s or short a breakdown below 122. Once we broke, the path of least resistance was lower (see: How Low Is Apple Going To Go August 20, 2015) and our downside targets were hit pretty quickly.
The problem since then is all of this overhead supply from that range since late February. All of that broken support turns into resistance. Where buyers once outweighed the sellers, there are now more sellers than buyers. The market proved that once prices broke support. We are seeing this polarity play out beautifully this week and have been pounding the table every Thursday morning on Benzinga Radio that we wanted to short Apple again into any strength towards that area.
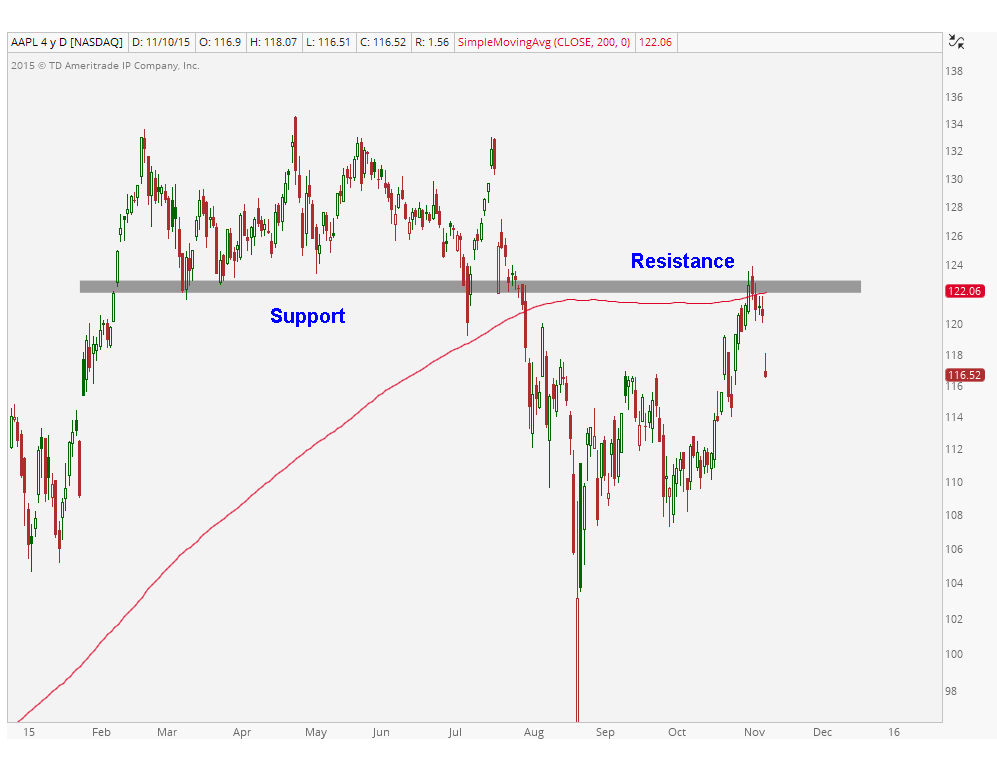
Until Apple can prove it can stay above that 122-123 area, there is no reason to own this from an intermediate term perspective. I would continue to cover shorts between $100-$104 which was our downside target in August and is still an area where I think it makes sense to cover tactical shorts. Can it go lower than that? Of course. But for now, that’s where we want to keep taking profits.
This is technical analysis 101: Polarity. It’s playing out before our very eyes. I like it.
***
Click Here to receive weekly updates on these Apple charts above including the rest of the 30 Dow components on multiple timeframes.
Recent free content from J.C. Parets
-
 Here’s Way I think Rates Are Heading Lower
— 11/12/15
Here’s Way I think Rates Are Heading Lower
— 11/12/15
-
 Video: Technical Analysis Webinar by JC Parets
— 10/01/15
Video: Technical Analysis Webinar by JC Parets
— 10/01/15
-
Find Your Edge: The Autumn 2015 AlphaShark Trading Symposium with a Presentation by J.C. Parets
— 9/25/15
-
Can Financials Correct 30% From Their Highs?
— 9/24/15
-
Where Is The S&P 500 Heading Now?
— 9/09/15