

Naz futures chart
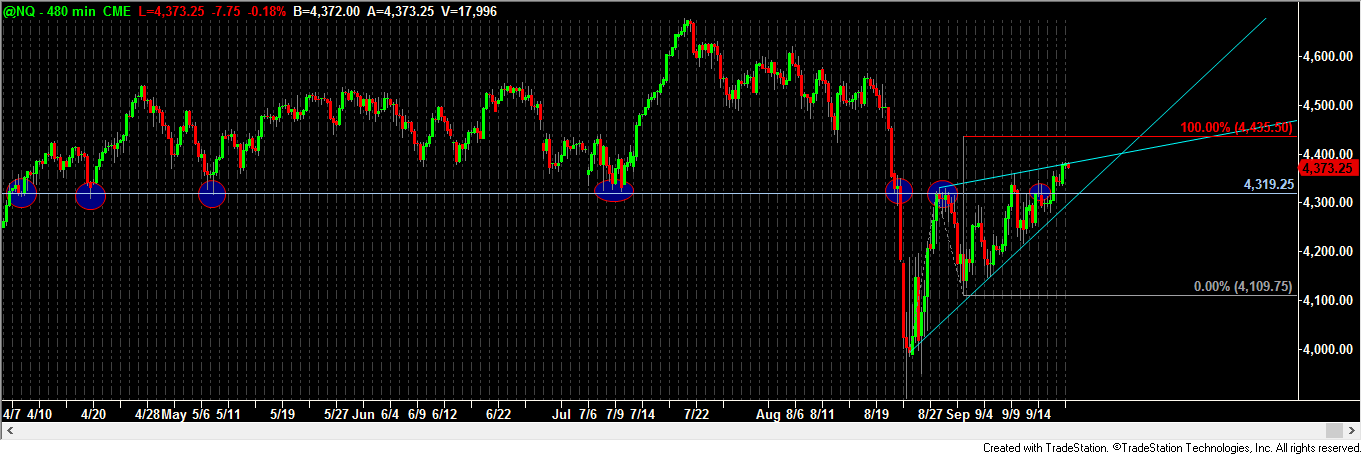
4319 - 4320 has been a significant level of either support or resistance for the last couple of months. I believe it will act as support once again as this upside correction ebbs and flows. 4435 is the eventual upside target for this upside correction. 4522 would be an extreme high projected target if different pivot points are used. So, let's say upside target following a brief pullback to 4319 will be 4435 - 4522.
Strategy: Cover shorts at 4320, reverse and go long there and hold for move up to 4435. Sell there. Look to short between 4435 and 4522 - depending on pattern that has formed at that point.
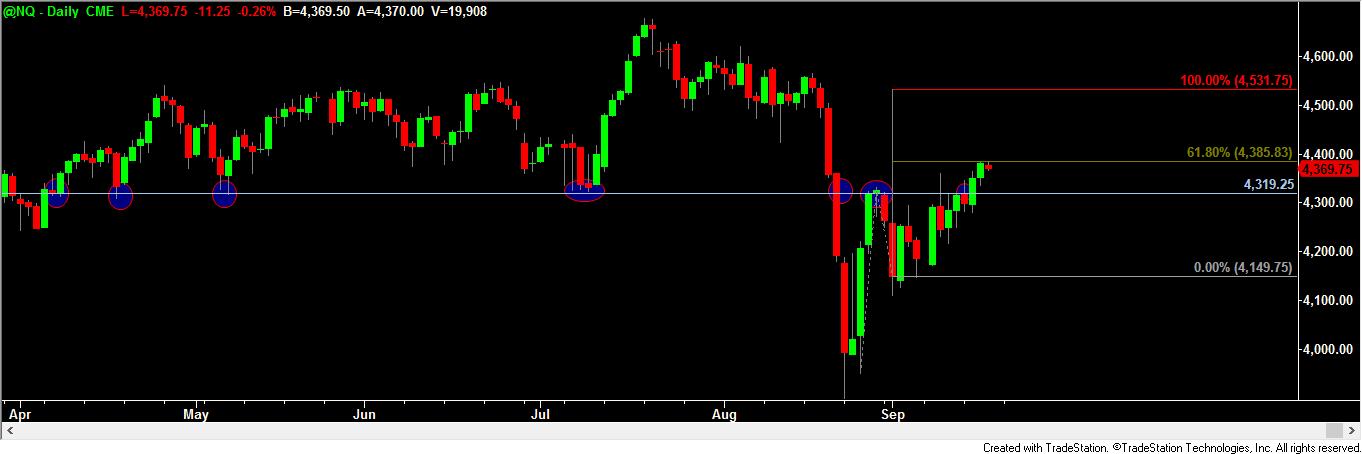
Now, here's the bearish view of the world:
Instead of the Naz futures projecting all the way up to the 100% Fibonacci projection line as noted above, they might have instead peaked at the 61.8% projection line on the daily chart - see the chart below. This resistance corresponds roughly with the upper edge of a rising wedge pattern. If the lower edge of that rising wedge - which comes in at the afore-mentioned 4319 level - is violated, this more bearish view of the world may, in fact, be the reality. Regardless of whether the bulls or the bears are right with their views, it is our view that 4319 is tested (likely today).
Recent free content from Peak Analytics & Consulting
-
 S&P futures may see short-term bounce ahead of test of 4,005
— 8/26/22
S&P futures may see short-term bounce ahead of test of 4,005
— 8/26/22
-
NASDAQ futures update...
— 3/08/22
-
AAPL historical pattern could lead market lower
— 8/03/20
-
UPDATED S&P FUTURES LEVELS BASED ON TODAY'S ACTION...
— 12/20/18
-
Headed to 2412 - 2417
— 12/20/18
-
{[comment.author.username]} {[comment.author.username]} — Marketfy Staff — Maven — Member
Reviews


- 1 Campus Martius, Suite #200Detroit, MI 48226
- +1 877 440 9464